
Market Report · GOLDEN
The road to 7 Nov 2028
The road to 7 Nov 2028
The market is at all-time highs under a "Golden Age" banner — and half the country is bracing for a crash. Both are watching the wrong thing. Since 1933, stocks have climbed under eight Republican presidents and eight Democratic ones. What they actually follow is a four-year cycle. Here's where we sit on the road to November 2028.
First documented by Yale Hirsch in 1967, the presidential election cycle is one of the most durable seasonal patterns in US markets. The logic is almost mechanical: a new administration spends its early years on harder, less market-friendly priorities, then turns to stimulating the economy as re-election approaches. The result is a recurring shape — soft start, strong middle, jumpy finish — that has repeated across both parties for decades.
Historically among the softer years, as a new term's priorities take shape. (Recent terms have sometimes bucked this.)
Historically the weakest and most volatile leg, as midterm elections cloud policy visibility. Yet 2026 is running at record highs.
Historically the strongest year of the four. Over the past four decades, the S&P 500 has not finished a third year in the red.
Historically solid but jumpy. Negative only in shock years (2000, 2008). This one is an open race — see below.
Averages are long-run historical figures (≈40–90 year samples) and are not forecasts
President Trump took office in January 2025. That places 2026 — right now — in the midterm slot, historically the softest year of the cycle. The twist: instead of the usual midterm weakness, the market is printing record after record. The Dow closed at an all-time high in early July, and the S&P 500 has set more than twenty record highs in 2026, with a first half up roughly 10%.
2027 is the pre-election year — historically the strongest leg of the whole cycle. Then comes 7 November 2028. But this election carries a structural difference: President Trump is term-limited and cannot run again, so 2028 is an open race, not a re-election. History suggests open and lame-duck election years tend to run jumpier than re-election years, when incumbents lean hardest on keeping the economy — and the market — buoyant.
One more pattern worth knowing: the market has quietly forecast the winner. When the S&P 500 rises in the three months before an election, the incumbent party has won 20 of the last 24 races since 1936. The tape, it turns out, often votes first.
A responsible read holds both at once. The strength is real — and so are the cautions sitting right beside it.
The cycle is a tendency, not a law. Each administration gives only four data points, the sample is small, and shocks — wars, crises, a pandemic — have erased the pattern before and will again. Treat it as a lens, never a lever.
And an all-time high is not a buy signal. It's just a high — records can continue for years or reverse in weeks. Nobody credible can tell you which, and this report makes no price targets and no predictions. It also takes no political side: markets have risen under both parties, and letting your politics run your portfolio is one of the most expensive habits in investing.
What this is: the historical record, organised so you can hold both the strength and the risk clearly, and decide for yourself. It is not financial advice.
The "Golden Age" story and the "coming crash" story are both just narratives — and narratives are where most investors lose. The rhythm above tells you the season. What tells you the weather is the disclosed record: where institutional money is actually positioning, quarter by quarter, beneath the headlines. Learn to read that, and you stop reacting to politics and start seeing the moves early.
Join the free live masterclass — US stocks, options, and how to read institutional money for yourself, on any company, before the story breaks. No hype. No price targets. Just the method, done live.
Save my free seat →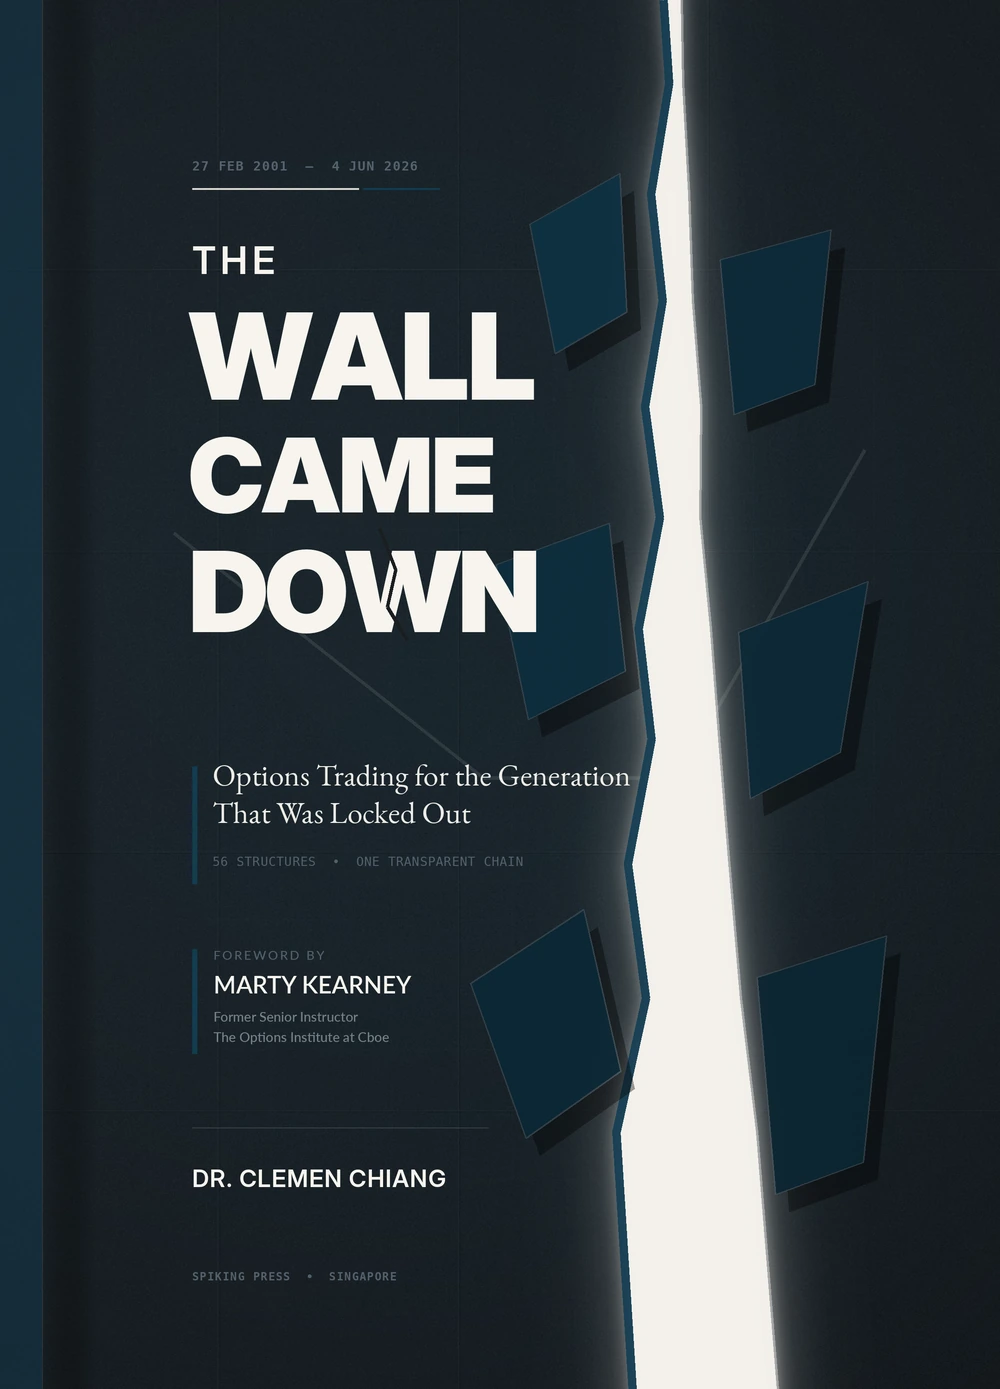 Spiking Press · from Dr. Clemen Chiang
The Wall Came Down.
Options trading for the generation that was locked out. All 56 structures, built from one transparent option chain you can recompute yourself — no signals, no winning-trade screenshots. Foreword by Marty Kearney, The Options Institute at Cboe.
Hardcover · Paperback · Kindle · Audiobook
Get the book →
Bought it on Amazon? Claim The 56 Options Trading Manual free with your order number at spiking.com/56/manual
Spiking Press · from Dr. Clemen Chiang
The Wall Came Down.
Options trading for the generation that was locked out. All 56 structures, built from one transparent option chain you can recompute yourself — no signals, no winning-trade screenshots. Foreword by Marty Kearney, The Options Institute at Cboe.
Hardcover · Paperback · Kindle · Audiobook
Get the book →
Bought it on Amazon? Claim The 56 Options Trading Manual free with your order number at spiking.com/56/manual