
Reading guide · FOOTNOTE
Educational · not advice
Educational · not advice
Every polished report — corporate, fund, or government — is built the same way: the headline makes you feel something, and the truth lives in the fine print. The skill isn't cynicism. It's knowing where to look. Here's how, using one of the most transparent reports out there as the teacher.
The long-run track record includes a one-time uplift from a change in how assets are valued — disclosed, but not on the poster.
We use Temasek's 2026 Review as our worked example precisely because it's excellent. Temasek is one of the most transparent funds on earth, and every single point below was published by Temasek itself — in its footnotes, filings and briefings. Nothing here is concealed, and nothing here is criticism. That is the whole lesson: the information you need is almost always disclosed — it just isn't in the big font. Learn to read one great report well, and you can read any report.
For each, the headline you see — and the footnote that adds the texture. Read them side by side.
This year Temasek finished switching how it values unlisted assets — from cost to market value. Because that data doesn't exist before 2016, the 20-year figure carries a one-time step-up at the transition. Fully disclosed in footnote 3 (and the 10-year is barely affected) — but easy to read straight past.
50% of the portfolio is unlisted — valued by models, funding rounds and comparables, not daily market prices. And a footnote most readers miss: over the decade those unlisted assets returned ~10% versus ~6% for the listed half. The outperformance sits in the assets markets don't price — worth knowing, not sinister.
AI is 6% of the actual portfolio today. The target is up to 15% by 2031. The branding is running years ahead of the money — which is fine, and normal, but a reader should know the difference between a theme and a position.
Over the same 20 years, a simple S&P 500 index fund returned roughly 10–11% (Temasek was 8% in US-dollar terms). Different mandate — a defensive sovereign fund isn't trying to beat the index — but a highlights sheet never puts that benchmark next to its own number. The reader has to.
The 5-year TSR was just 4.6%, dragged by China — the chart even labels it "China Market De-rating." It's disclosed and explained; it simply isn't the headline. Reports lead with their friendliest true number.
Three currency bases, all disclosed — and the two more flattering ones get equal airtime. The number the Singapore-dollar shareholder actually received was 10.5%. When several versions of a figure appear, notice which one leads.
Annual report, fund letter, or a pitch deck across the table — the same eight questions surface what the presentation would rather you skim.
Before the headline. The caveats, the "how we calculated this," and the "excludes…" all live down there.
Market prices, or models and estimates? The more that rests on judgement, the more the top-line number is an opinion.
A new accounting basis, a new benchmark, a shifted time window — any change that happens to flatter the number deserves a second look.
Did it beat a basic S&P 500 fund? If the report doesn't show the benchmark, do the comparison yourself.
Is the big theme — AI, growth, "the future" — actually a big position, or an aspiration with a target date?
When multiple versions of a figure exist, the one in the biggest font is usually the most flattering.
It's almost always disclosed — just not the headline. Find it, and you've found what they'd rather you didn't dwell on.
Then check whether the report addresses it. Silence on the obvious risk is itself information.
This guide teaches a reading skill — nothing more. It is not a criticism of Temasek, whose report is a model of transparency, and it is not a recommendation to buy, sell, or avoid Temasek, any company it owns, or any security. It contains no price target.
The point is not to distrust reports — it's to read them completely. Good reports and bad ones look similar at headline distance; the footnotes are where they differ. Figures cited are from Temasek's own 2026 Review and public disclosures, current to mid-July 2026.
Educational, decision-support material only — not financial, investment, legal, or tax advice.
Join the free live masterclass and learn to read the disclosed record for yourself — the filings, the fine print, and the flows beneath the story — across US stocks and Singapore property alike. No hype. No price targets. Just the method.
Save my free seat →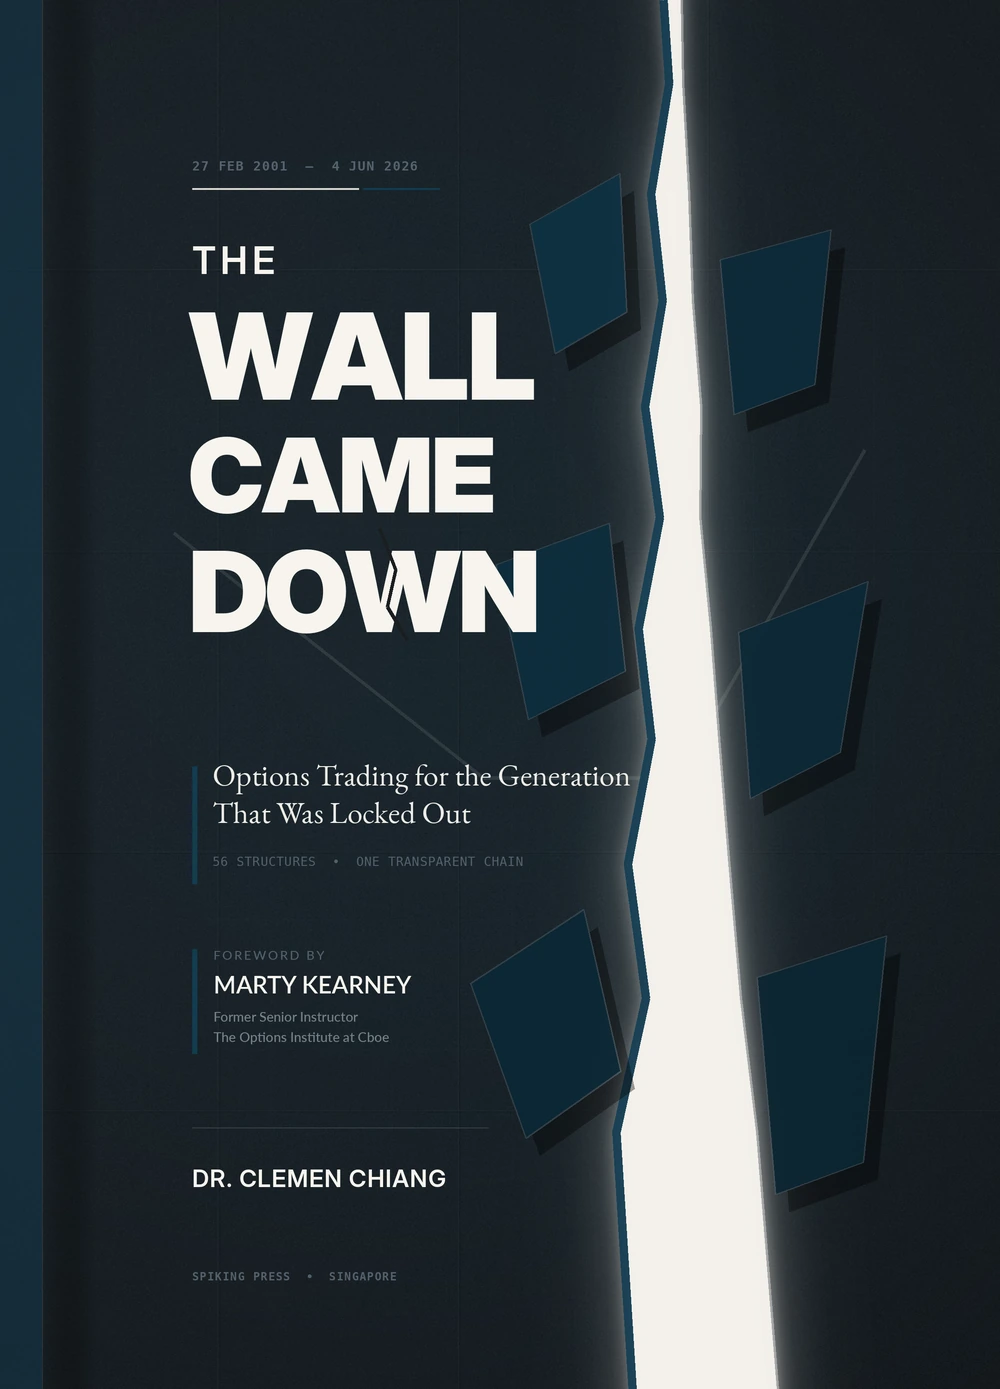 Spiking Press · from Dr. Clemen Chiang
The Wall Came Down.
Options trading for the generation that was locked out. All 56 structures, built from one transparent option chain you can recompute yourself — no signals, no winning-trade screenshots. Foreword by Marty Kearney, The Options Institute at Cboe.
Hardcover · Paperback · Kindle · Audiobook
Get the book →
Bought it on Amazon? Claim The 56 Options Trading Manual free with your order number at spiking.com/56/manual
Spiking Press · from Dr. Clemen Chiang
The Wall Came Down.
Options trading for the generation that was locked out. All 56 structures, built from one transparent option chain you can recompute yourself — no signals, no winning-trade screenshots. Foreword by Marty Kearney, The Options Institute at Cboe.
Hardcover · Paperback · Kindle · Audiobook
Get the book →
Bought it on Amazon? Claim The 56 Options Trading Manual free with your order number at spiking.com/56/manual